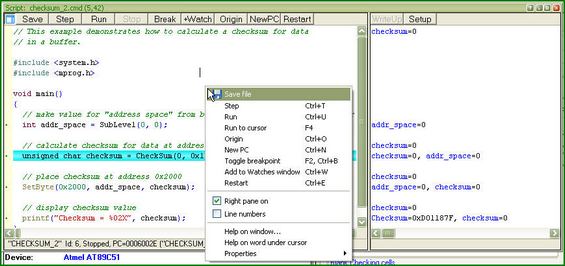
Starting scripts Scripts can be started and restarted in several ways. The easiest one uses the commands of the Script Files dialog: •to start a new script enter the file name into Start new script file box and click the Start button in the bottom part of the dialog box; •to restart a stopped script highlight its name in the dialog window that displays all the loaded scripts and click the Restart button. A script can be also started by means of the StartCommandFile() function executed by another running script. Debugging scripts A script can be started for an immediate execution (read above) and can be launched in the Debug mode that usually is necessary while you master the script and need to check if it properly works and make necessary corrections in it. To start the script debugging highlight its name in the Script Files dialog window and click the Debug button - the program opens the window with the script file's editable text. The window is split in two panes: the left pane displays the script text, the right one is the AutoWatches pane. If you check the Debug box then every time when you start a script it will automatically switch to the Debug mode, stop the script execution and open the window with the script file. Local menu and toolbar The local menu window contains the following commands, most of which are duplicated by the corresponding buttons on the window toolbar:
Note. To get help on a function or variable, point to the function or variable with the cursor and click. For more information, see How to Debug a Script File and Script Files. For customizing the ChipProg user interface and debugging purposes scripts themselves can open two types of additional windows: the User window and the I/O Stream window.
|