The Buffer Dump window displays the contents of the memory buffer.
ChipProg supports a flexible buffer structure:
This flexible structure allows for easy manipulation of several data arrays that are mapped to different buffers. To open a Buffer Dump window, click on the command Main Menu > View > Buffer Dump.
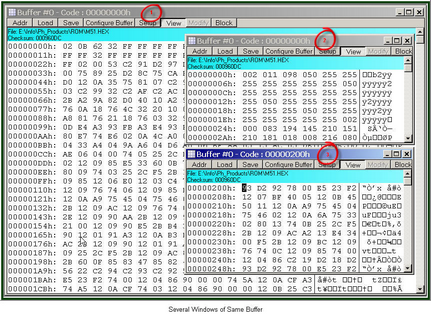
The picture above displays three Buffer Dump windows representing three parts of the same buffer: • #1 (the largest) shows the buffer contents beginning at address 0h; • #2 shows the same buffer contents beginning at the same address but displaying data in decimal format; • #3 window shows the data beginning at address 200h. The left-most column in the windows above shows absolute addresses of the first cell in a row. The addresses always increment by one byte: 0, 1, 2…. Each address is followed by a semicolon (:). When you resize the window it automatically changes the addresses shown in the address column in accordance with the number of codes or data that go in one line. Some windows may be split into two panes – left pane for data in a selected format and right pane showing the same data in ASCII format. The window has a toolbar for invoking setting dialogs and commands. Right under the toolbar the program displays a full path to a loaded file and a checksum of the dump. Local menu and Toolbar The local menu, which can be opened by the right mouse click, includes the Buffer Dump window context commands and dialog calls. Most, but not all, of the local menu lines are duplicated by the local toolbar buttons displayed at the top of the window. Here are the local menu and toolbar items:
|